The fall of the Asian market dominoes was the biggest investment story of 1997 and may have created the biggest opportunity of 1998. The challenge is to find a good way through opportunity’s window before it closes.
At Palisades Hudson Asset Management, we think the countries that have the best infrastructure, the most skilled work forces and the most open political and economic systems will enjoy the quickest and strongest recoveries from their current woes. For countries such as Indonesia, riddled with corruption and the uncertainty of one-man rule, the Crash of 1997 may represent a return to more realistic valuation levels. But in fundamentally sound places such as Japan, South Korea and (if Beijing keeps its distance) Hong Kong, the plunge looked like just the time to pick up investments at a steep markdown.
We do not believe the Efficient Market Theory that we discuss in our accompanying story, Should Fund Managers Be Expected to Outrun The Bulls, applies very well in non-U.S. stock markets, especially the smaller ones.
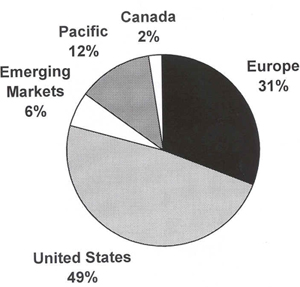
So the collapse of Asian stock prices is one factor that put us in the market for those investments early this year. Another factor was, simply, the long rise in U.S. stock prices. We basically are asset allocators, and we generally try to keep 20% to 25% of the equity portfolios we manage in non-U.S. investments. The steep rise in U.S. stock values would have pushed us to re-balance the portfolios in favor of foreign stocks even if Asian markets had held steady.
Like many of our readers, we do most of our investing through mutual funds. Our problem, like yours, was to select funds that did what we wanted our investment portfolios to do. We began by looking at the global non-U.S. funds that we were using. We found that these were more concentrated in Europe and less in Asia than we felt was warranted after the Asian market debacle. So, while we kept these global funds in place, we decided to augment them with some Asia-only funds to boost our exposure there.
Using the Morningstar mutual fund database, we looked for the usual combination of country, company and industry diversification, and reasonable operating costs. We also biased our search away from mutual funds that were heavily invested in places like Indonesia, Malaysia and Thailand, where the political underpinnings for recovery seemed much more tenuous than in the more open and free-market societies.
We also screened for funds whose portfolios generated relatively high cash flow. For non-U.S. investments we consider price-to-cash-flow a much better measure of value than price-to-earnings, because “earnings” is an accounting concept that is meaningless when applied across widely varying accounting standards. We also reasoned that companies with stronger cash flow were better positioned to withstand credit tightening, bank defaults and other fallout from the current financial crash.
Finally, we tilted our search in favor of investments in larger companies. Larger companies, we thought, would not only benefit from recovery at home in the long term, but would be better positioned to sell product abroad in the short term to ride out the current local recession.
Our Morningstar search came up with the following choices. All data is as of February 28, 1998 except for country exposure that uses the most recent information available from each fund.
Selected Pacific Basin Mutual Funds And Relevant Statistics
| Country Exposure | Annualized Return (2/28) | ||||||
| Funds | Japan | Pacific | 1 year | 3 year | Expense Ratio | Price-to-Cash Flow | Median Market Cap ($Billion) |
| Merrill Lynch Pacific D | 65.2% | 28.1% | 3.7 | 9.5 | 1.12 | 14.9 | 8.1 |
| Fidelity Pacific Basin | 76.0% | 20.4% | (6.9) | (3.0) | 1.31 | 13.6 | 5.1 |
| Putnam Asia Pacific Growth A | 34.9% | 48.0% | (12.7) | 0.8 | 1.50 | 14.6 | 7.8 |
| GAM Pacific Basin A | 31.4% | 59.9% | (26.1) | (4.7) | 1.76 | 12.8 | 5.0 |
| Prudential Pacific Growth A | 35.7% | 47.9% | (28.8) | (5.1) | 1.48 | 14.0 | 2.7 |
| Templeton Pacific Growth I | 19.4% | 68.4% | (33.8) | (6.8) | 1.63 | 13.4 | 3.1 |
Merrill Lynch Pacific D fund, clearly the best performing fund in this set, took shelter in Japan during the Asian storm. Its hiding place was so safe that it actually registered a positive return for the year ended February 28, 1998, the only diversified Pacific fund to achieve such a feat. Selecting Japanese blue chips gave the fund the highest median market capitalization of all the Pacific funds we evaluated. Though it had even more exposure to Japan than Merrill Lynch did, the Fidelity Pacific Basin fund did not fare as well. However, the fund should be recognized for its minimal loss, less than 7%, and its 3% front-end load, the lowest of our group.
A note here about loads: all of the funds listed here impose these sales charges, but the loads usually are reduced or eliminated for larger investments. Also, certain funds are available to clients of money managers at no load or at reduced charges. Palisades Hudson clients, for example, pay no loads on the GAM Pacific Basin fund.
The Putnam offering fared reasonably well during the turmoil. Its portfolio mostly consisted of blue chip companies, with Sony and Canon its two largest holdings. It has also finished in the top half of its Morningstar category in five of the last six years.
GAM Pacific Basin fund has the lowest price to cash flow ratio of all the funds we considered. The fund has made a huge bet on the stronger Asian banks as evidenced by its 42% stake in the financial sector. GAM has finished in the top half of the Pacific-Non Diversified category in eight out of the last ten years.
Prudential Pacific Growth’s recent manager change may have a material effect on the fund’s future results. The new manager, Steve Auth, prefers to select the best companies in the Pacific rather than each specific country’s best stocks. This approach led him to cut the fund’s prior 50% Japanese exposure to 36%. Also noteworthy is this fund’s sizable cash stake of 21%.
The final fund to clear our screen was the Templeton Pacific Growth I. It emphasizes smaller companies (reflected in its median market capitalization, the lowest of this group) and it holds a relatively small stake in Japan. On both these points, it deviated from our own selection bias. On the other hand, you might feel differently about the prospects of Japan vis-à-vis the rest of the region, or about the relative merits of smaller companies, so you might be interested.
If and when you begin your search for Pacific Rim funds, be cautious about comparing like funds. Morningstar categories include Diversified Emerging Markets, Diversified Pacific/Asia Stock, Pacific/Asia ex-Japan Stock and Japan Stock. Another avenue to consider is to add a combination of funds in different categories to your Pacific Rim portfolio. For instance, if you select a fund such as Templeton Pacific Growth I but still require more exposure to Japan, you could choose a Japan-only fund to reach the balance you want.
It would be difficult to perform all of the research that I have done without using the Morningstar CD-ROM database, but a more rudimentary search can be performed on the Internet. Logging on to http://www.quicken.com/investments/mutualfunds/finder is your best bet. This Web site allows you to search by Morningstar category. You can refine your search using such variables as Morningstar rating, load, net assets, expense ratio, annualized returns, and others. Morningstar’s own web site, http://morningstar.com, does not allow as sophisticated a search.